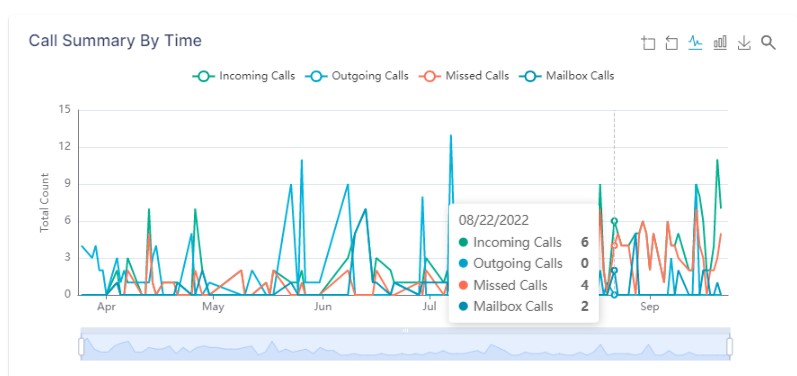
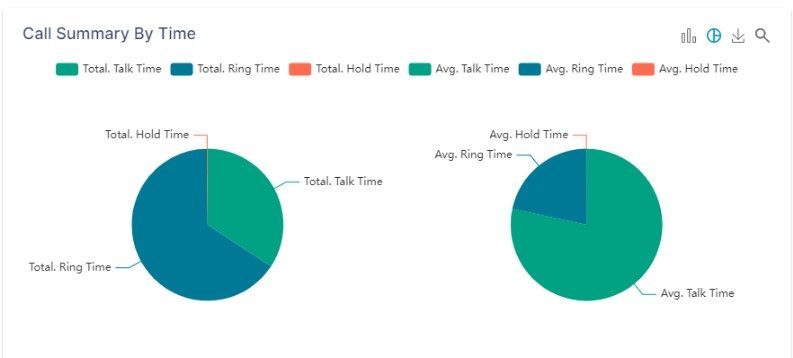
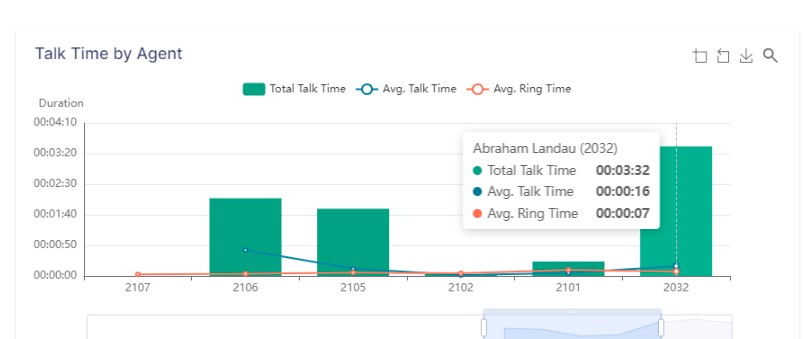
TeleGo is excited to present our new, customizable dashboards, which are available for our Customer Portal users. Customers can now create their own curated views for Call Analytics data, Agent Summary data, and Group Summary data in an entirely new way!
New, interactive features include:
Detailed filters to apply to agent data, group data, time frame data
Line chart, bar chart, or pie chart view options
Manual zoom in and out functionality on specific metrics, and fullscreen chart expansion
The ability to export and download any custom charts
The option to view Total vs Average metrics for stats like talk time, hold time, and more
We’d love to hear what you think! Contact us to learn more!